Usage
Building a CliMetLab query
The WEkEO CliMetLab Plugin gives access to a wide range of WEkEO datasets. All WEkEO datasets can be explored in the WEkEO Viewer.
The CliMetLab WEkEO CLMS Plugin supports the datasets published by the Copernicus Land Monitoring Service.
A dataset can be accessed using CliMatLab with the load_dataset function.
The minimum required argument for the function load_dataset is the dataset id.
The CliMetLab dataset id can be derived from the dataset id inside the WEkEO viewer. For example:
WEkEO dataset id:
EO:CLMS:DAT:CGLS_HOURLY_LST_GLOBAL_V2CliMetLab dataset id:
wekeo-clms-cgls-hourly-lst-global-v2
import climetlab as cml

ds = cml.load_dataset("wekeo-clms-cgls-hourly-lst-global-v2")
This code will download all available data in this dataset. As this means the download of large volumes of data (not advised), it is necessary to further subset the query by dataset attributes. There are two ways to find the available attributes for each dataset:
Explore attributes in the WEkEO Viewer
Explore attributes in the Plugin source code
Each dataset is described with its attributes in a separate python file in the plugin source code.
The above-described Land Surface Temperature (LST) dataset can be found here.
Now, a CliMetLab query for WEkEO data can be created:
import climetlab as cml

ds = cml.load_dataset(
    "wekeo-clms-cgls-hourly-lst-global-v2",
    start="2021-07-01T00:00:00Z",
    end="2021-07-01T23:59:59Z",
)
Accessing a single dataset through CliMetLab
This query triggers the download of a subset of a single dataset.
import climetlab as cml

ds = cml.load_dataset(
    "wekeo-clms-cgls-hourly-lst-global-v2",
    start="2021-07-01T00:00:00Z",
    end="2021-07-01T23:59:59Z",
)
The download result is stores in chache. Running again the cml.load_dataset for the same dataset and the identical parameters will not trigger a new download, but will use the cached data instead.
After downloading, the dataset can be converted to xarray using the to_xarray function:
xarr = ds.to_xarray()
xarr
Using the python xarray module, the dataset can be analyzed and plotted.
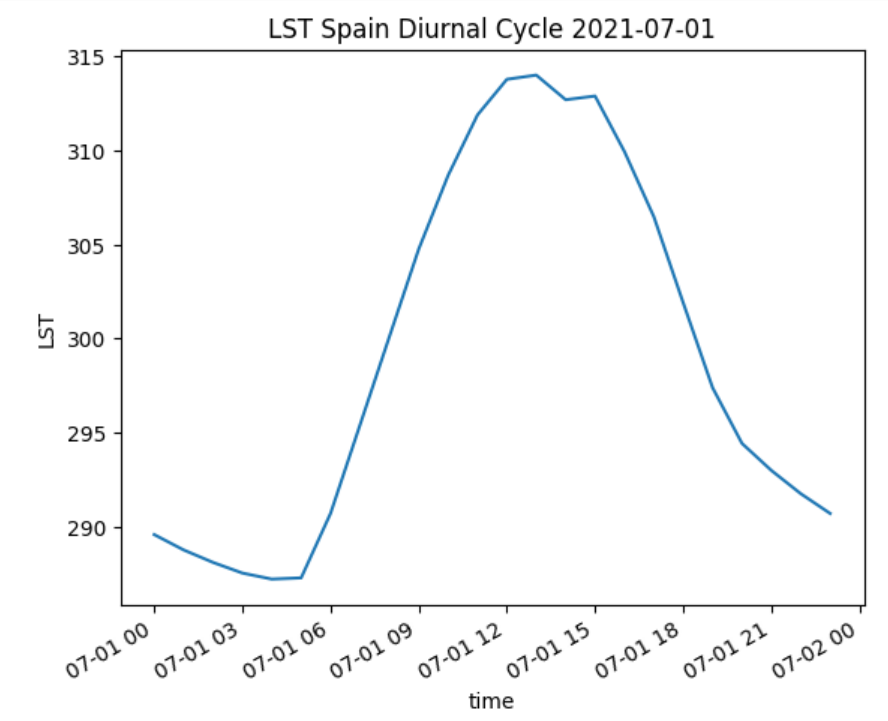
#create a spatial subset of the data

lst_spain = xarr.sel( lat=slice(44.1, 35.6), lon = slice(-10, 4))[['LST']]
lst_spain.attrs["title"] = "LST Spain 2021-07-01"

# summarize the mean LST for the area of Spain

lst_spain.LST.mean(dim=["lat", "lon"]).plot.line(x="time")
plt.title ("LST Spain Diurnal Cycle 2021-07-01")
Working with two or more datasets using CliMetLab
In many cases it is necessary to combine more datasets and variables for data analysis. Using the WEkEO CliMetLab Plugin, datasets from different sources can be downloaded and combined.
The LST dataset used in the previous sections is available in the date range betweel 2021-01-18 and today.
If we want to compare the LST of 2021-07-01 with the LST of the previous year, it is necessary to query the Version 1 of the dataset:
wekeo-clms-cgls-hourly-lst-global-v1 and combine it with the new version of the dataset.
import climetlab as cml
import xarray as xr
import matplotlib.pyplot as plt
ds_v1 = cml.load_dataset(
"wekeo-clms-cgls-hourly-lst-global-v1",
start="2020-07-01T00:00:00Z",
end="2020-07-01T23:59:59Z",
)
#convert to xarray
xarr_v1 = ds_v1.to_xarray
#concatenate along the time dimension to have a consecutive time series
lst = xr.concat([xarr, xarr_v1], dim="time")
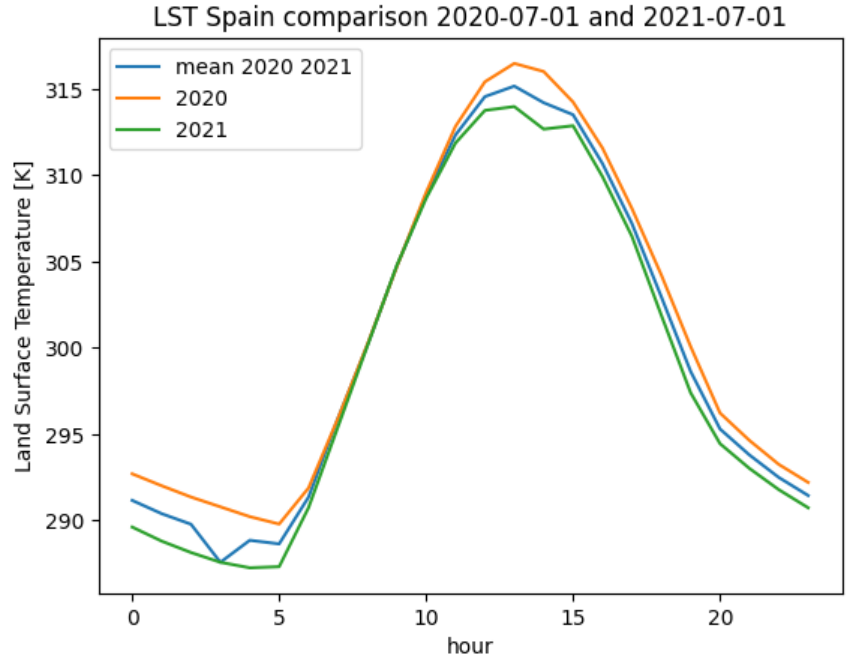
#compare the two dates within one plot
import matplotlib.pyplot as plt
lst_spain.groupby("time.hour").mean(dim=["lat", "lon", "time"]).LST.plot.line(x="hour", label="mean 2020 2021")
lst_spain.isel(time=(lst_spain.time.dt.year == 2020)).groupby("time.hour").mean(dim=["lat", "lon", "time"]).LST.plot.line(x="hour", label = "2020")
lst_spain.isel(time=(lst_spain.time.dt.year == 2021)).groupby("time.hour").mean(dim=["lat", "lon", "time"]).LST.plot.line(x="hour", add_legend = True, label="2021")
plt.legend()
plt.title ("LST Spain comparison 2020-07-01 and 2021-07-01")
Handling Merge errors
The to_xarray function is not supported for all datasets depending of the datasets’ shape and variable names. In such cases the following error will occur:
Error
MergeError: Cannot safely merge your data. Try to download a single variable or loop over the files and call to_xarray on each one.
For a dataset example on how to possibly handle this error, please refer to the CliMetLab WEkEO ECMWF Documentation
Caching and Storage of CliMetLab datasets
The CliMetLab source module works with caching instead of storing files in the local file system. This brings the advantage that the user does not have to clean up the local disk, but the files will be removed automatically when the cache is cleared.
Warning
When working with large datasets the files will fill up the computers cache, or the data cannot be fully downloaded if the queried volume does not fit fully in cache.
For large volumes of data it is recommended to change the default location where CliMetLab stores the data from cache to a large disk or object storage. All benefits of the data management of CliMetLab remain, except the datasets are not deleted when the cache is cleared. They will be persistent on the drive instead.
import climetlab as cml

cml.settings.get("cache-directory") # Find the current cache directory

"/tmp/climetlab-$USER"

# Change the value of the setting
cml.settings.set("cache-directory", "/big-disk/climetlab-cache")

# Python kernel restarted

import climetlab as cml
cml.settings.get("cache-directory") # Cache directory has been modified

"/big-disk/climetlab-cache"
More information on caching can be found in the official documentation of CliMetLab (Caching).